This post shows how SDP can ingest multiple data streams, transform them, and power real-time dashboards/alerts.
Observability App bundle: Customer Jumpstart on SDP Demo
Observability Application on SDP
Introduction
Modern IT and network systems are made up of many components, including hardware, software as well as external services. Difficulties arise when there are failures, errors, slowdowns or other anomalies that don’t appear to have any direct evidence of their origin. When some other, seemingly unrelated, data or pipeline ultimately turns out to be the culprit it can take a team of individuals using a wide variety of diagnostic tools and log analysis techniques to arrive at the chain of events that manifest the problem.
As part of solving these types of problems, customers many times will pull logs and telemetry from different systems involved with the failure and then manually align the data on similar time windows to try to see what seems to correlate with the problem. This process is slow and almost always as a post-failure review that can typically leave the problem unsolved for hours or days.
Modern Data Center designs along with sophisticated cloud management platforms have this complexity at their heart and are a good example of where this type of diagnosis requires an automated and rapid method to discover these correlations, and ideally even predict the issues prior to them occurring.
Observability Demo Application
The following Streaming Data Platform (SDP) application example showcases how enterprises with similar complex real-time systems with many interconnected microservices can use SDP to ingest many different data streams in parallel, do data transformations and drive real-time dashboards and alerts.
The included code sample lets the user run an install script to easily setup a project on SDP with their preferred Pravega streams and Flink jobs they want to run. This example can easily be expanded to do correlation of events across those streams and do anomaly detection for unusual events or patterns that occur, even across completely unrelated systems.
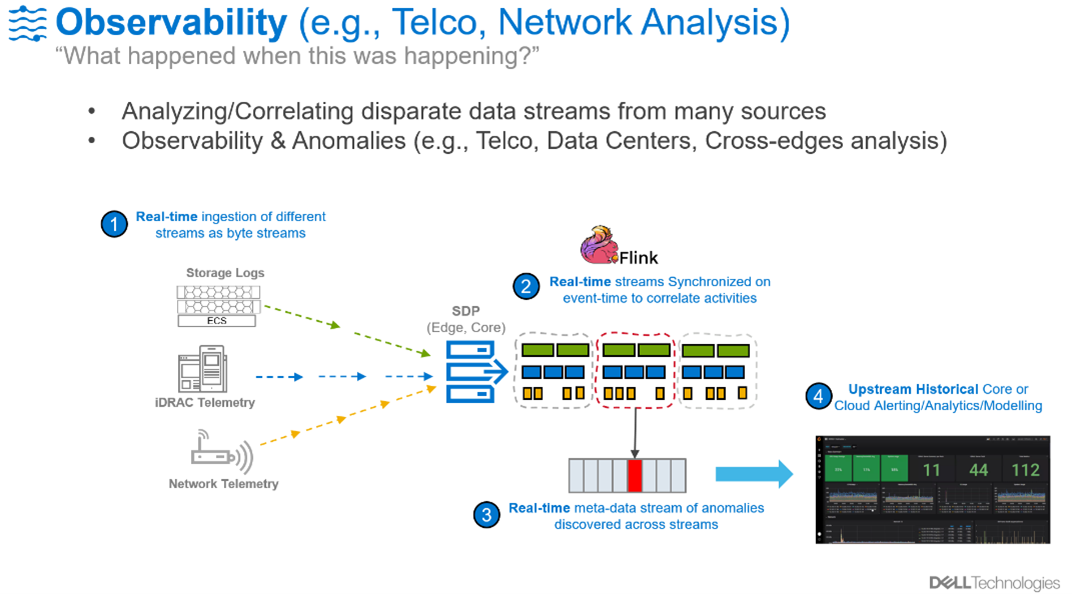
This example will use data streams that are typically available for many enterprises to show how this process is done: iDRAC telemetry, Kubernetes metrics and vSphere data. But there is nothing specific about these streams, you can alter this demo to include you need for your specific challenge.
Design/Detail

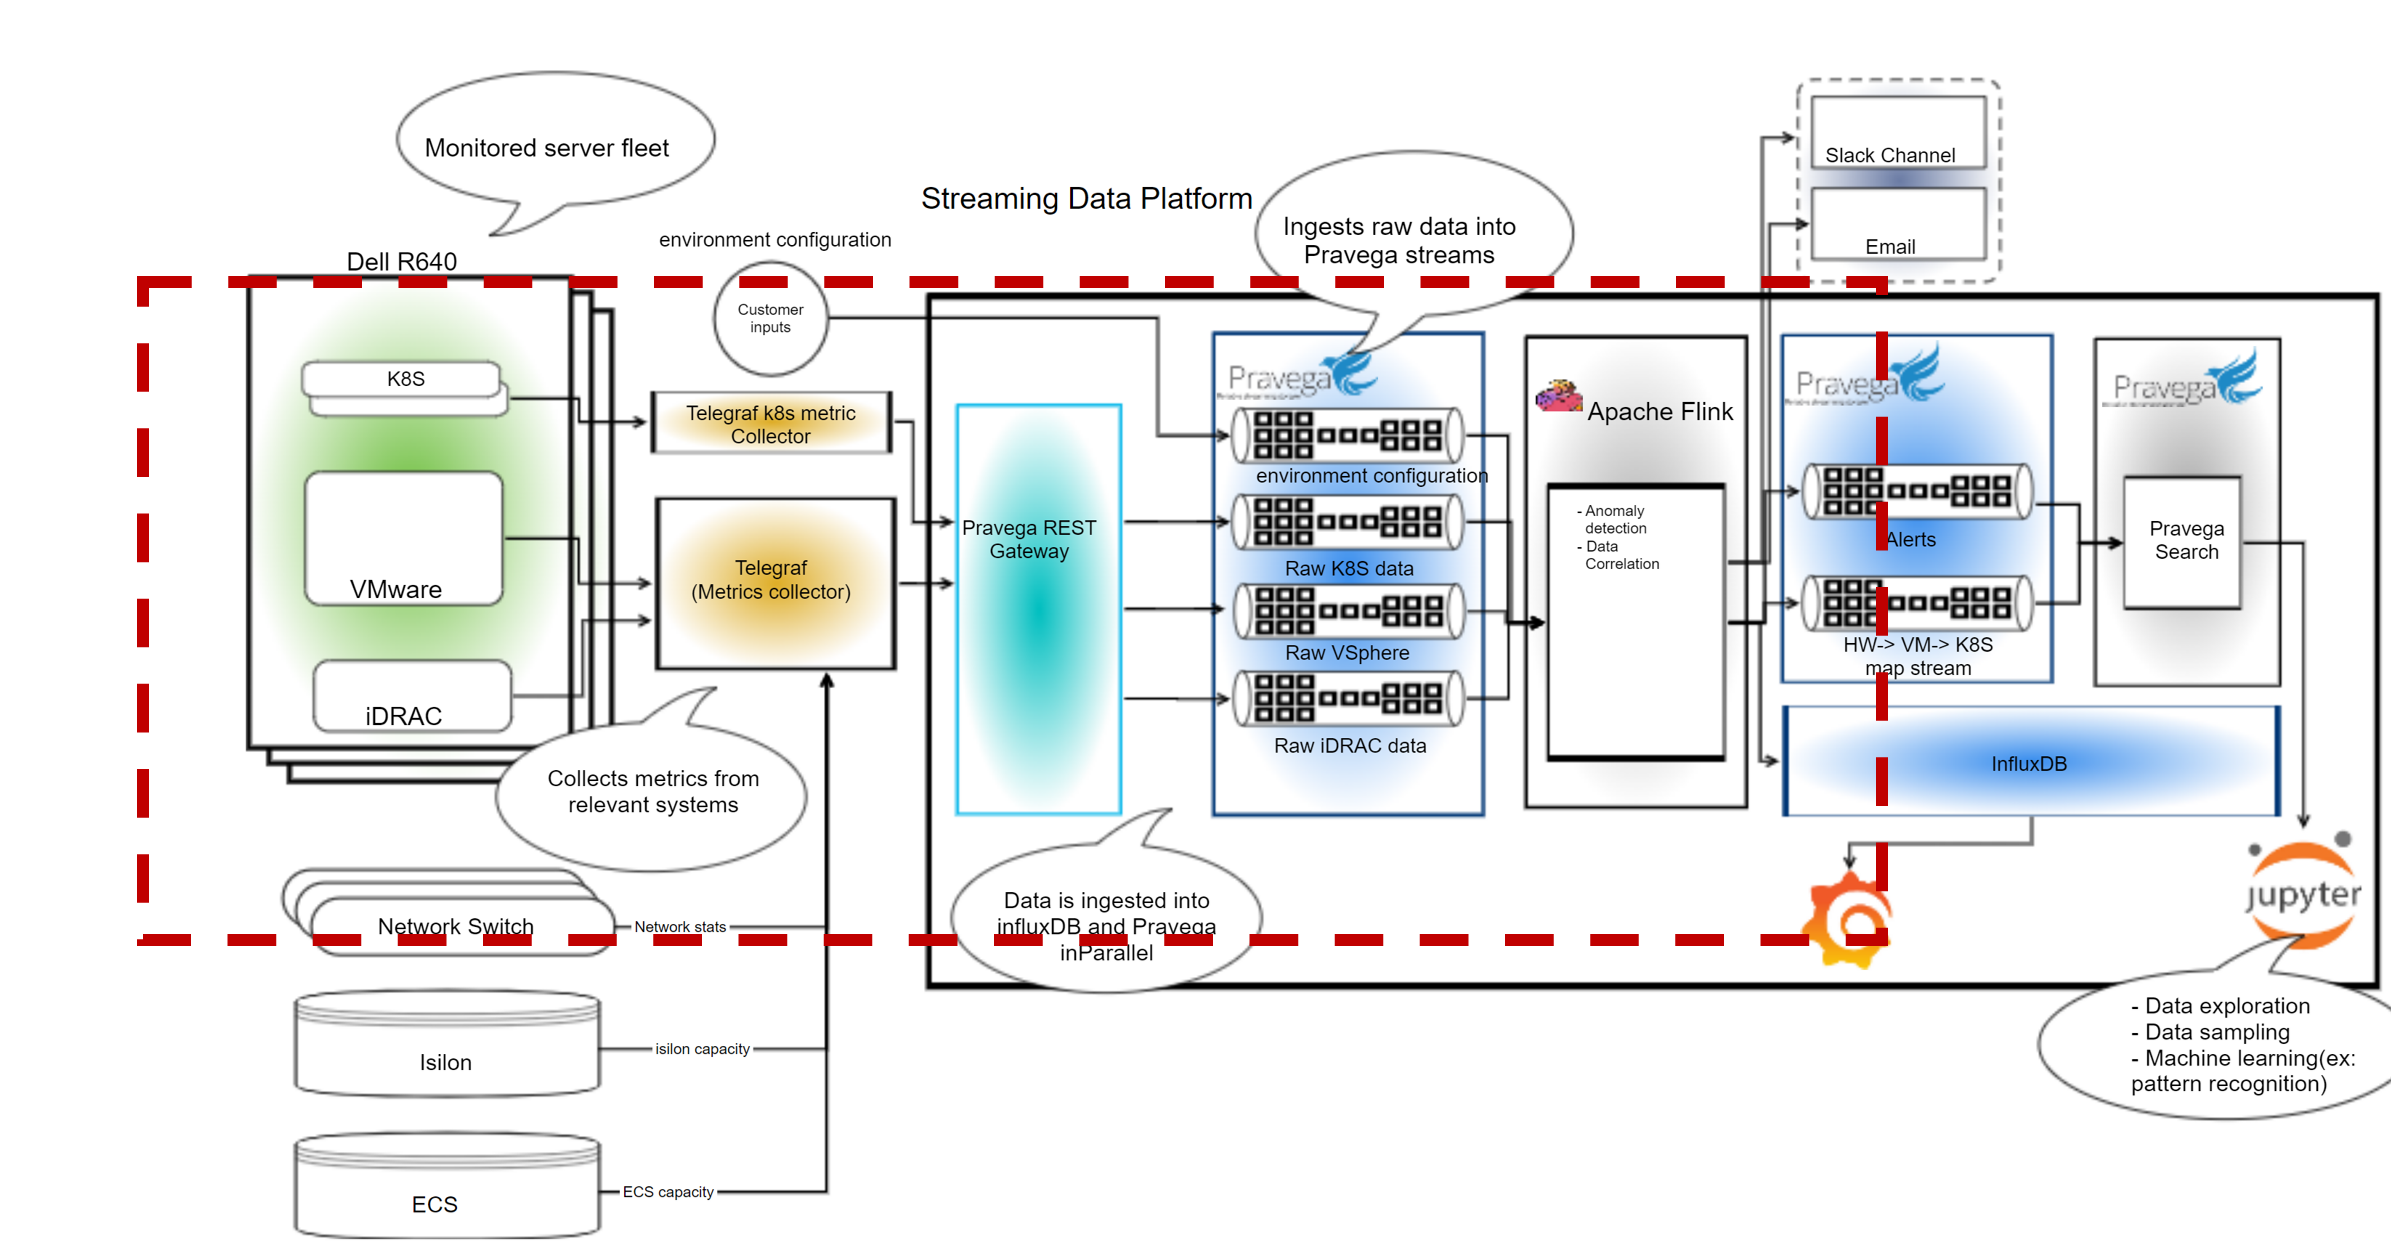
Figure 1: Architecture design of Code Sample
This high-level diagram highlighted in red shows all the components which are used in this sample application.
- The first component within the green box represents the data sources which include iDRAC, VMware, and k8s data on groups of servers.
- The second component, from the left (designated in yellow) is the Telegraf agent which is used to collect the data and output it to the SDP REST gateway.
- The third component (colored in Teal) is the Pravega REST gateway which is a REST endpoint that receives data from Telegraf and writes to Pravega streams.
- The fourth component next (in blue), represents the Pravega streams which are used to read continuous data.
- The fifth component (with a light grey background) is the Apache Flink engine which is used to do some data analysis and transformations. While we use Flink here the user can swap out Apache Spark or Gstreamer based on their specific use-case and input data streams.
- Finally, the last components represent where we are sending our results of the analysis and data transformations from Flink, in this case InfluxDB database with Grafana to view the data. Many times, this could be another Pravega Stream that the results are sent to, allowing for a multi-step pipeline of activities where data is ingested, transformed, and analyzed as a sequence of steps.
The data source and Telegraf agent is set outside of SDP and the Pravega ingest rest gateway, Pravega streams, Apache Flink, InfluxDB and Grafana are all part of SDP.
The End-to-End flow of this code sample can be thought of like this:
- First the Telegraf agent collects data from different input systems which the user can configure.
- The Telegraf agent then outputs the data to the Pravega rest gateway, which is a rest API endpoint.
- The Pravega REST gateway receives the data and writes it into the individual Pravega streams.
- After deploying our example transformation Flink Jobs (can be anything provided by the user), the Flink jobs read the data from the Pravega streams and execute the Job.
- In this example, the example job provided by the application will read the stream data and run the map metrics job and then write the results out to Influx and create a new stream with combined idrac, vsphere and k8s data.
- Finally, the results can be shown on the Grafana dashboards (deployed by the sample code)
Instructions
Prerequisites:
- Python 3
- Helm v2 or later
- Gradle 7.2
- SDP v1.6 or later
- Java 11
Preparation of User master yaml file:
The user master yaml file is the main file used to setup everything for this project for the user. This yaml file contains multiple options that users can customize for the project. To view the master yaml file go into the telcom-demo-app-bundle folder and open the sample.yaml file. Areas where the user can customize the master yaml file are:
-
Project Name: The user can change the project name to their choice. The default project name provided is examples. Important naming convention: The name can be a max length of 15 characters, consist of lower-case alphanumeric characters or ‘-‘, and must start and end with an alphanumeric character.
- Storage Class Name: The user must change the storage class name to their storage class name on kubernetes. To find out your default storageClassName run kubectl get storageclass
global:
projectName: examples # User can change to any project name default project name is examples
openshift: false
project-feature:
  ingestgateway:
    keycloak:
      roles:
      clients:
      - default
      mapping:
storageClassName: standard
Figure 2: User Master Yaml file Project Name
- Data Sinks: The user can add outputs as data sinks which Telegraf can output data to. Default outputs are set to influxDB, and HTTP is used by the Pravega rest gateway. To add new outputs, see the Telegraf output plugins. at https://docs.influxdata.com/telegraf/v1.14/plugins/plugin-list/.
  streams:
  - name: default
    outputs: # Users can add outputs. Default outputs set to influxDB and SDP Pravega rest gateway
    - influxdb:
        url: http://project-metrics.newproject.svc.cluster.local:8086
        database: examples
        username: default
        password: default
    - http:
        url: http://ingest-gateway.newproject.svc.cluster.local/v1/scope/examples/stream/streamName/event?routingKeyType=none&addTimestamp=Timestamp
        timeout: 5s
        method: POST
        data_format: json
        headers:
          Content-Type: application/json; charset=utf-8
          X-Pravega-Client-ID: default
          X-Pravega-Secret: default
Figure 3: Telegraf Outputs
- Data Sources: The user can add inputs as data sources which Telegraf can read data from. The default inputs in this project must be changed by the user to point to their data sources. This project implements 3 inputs as default. They are k8s,idrac and vsphere, shown in Figure 4, 5 and 6. The input format is shown in Figure 8 below.
    Inputs:
      input1:
      input2:
      input3:
        name: k8s
        prometheusCheck: true
        input:
        - http_listener_v2:
            service_address: :8080
            paths:
            - /receive
            data_format: prometheusremotewrite
Figure 4: Input with stream name k8s, push data to prometheus, and data source input is http listener
    Inputs:
      input1:
        name: idrac
        prometheusCheck: false
        input:
        - snmp:
            agents:
            - 10.243.61.74
            - 10.243.61.75
            - 10.243.61.77
            - 10.243.61.78
            - 10.243.61.79
            - 10.243.61.80
            - 10.243.61.81
Figure 5: Input with stream name idrac, Not pushing data to prometheus, and data source input is snmp agents
    Inputs:
      input1:
      input2:
        name: vsphere
        prometheusCheck: false
        input:
        - vsphere:
            insecure_skip_verify: true
            vcenters:
            - https://10.243.61.115/sdk
            username: administrator@vsphere.local
            password: Testvxrail123!
Figure 6: Input with stream name vsphere, Not pushing data to prometheus, and data source input is vsphere vcenter
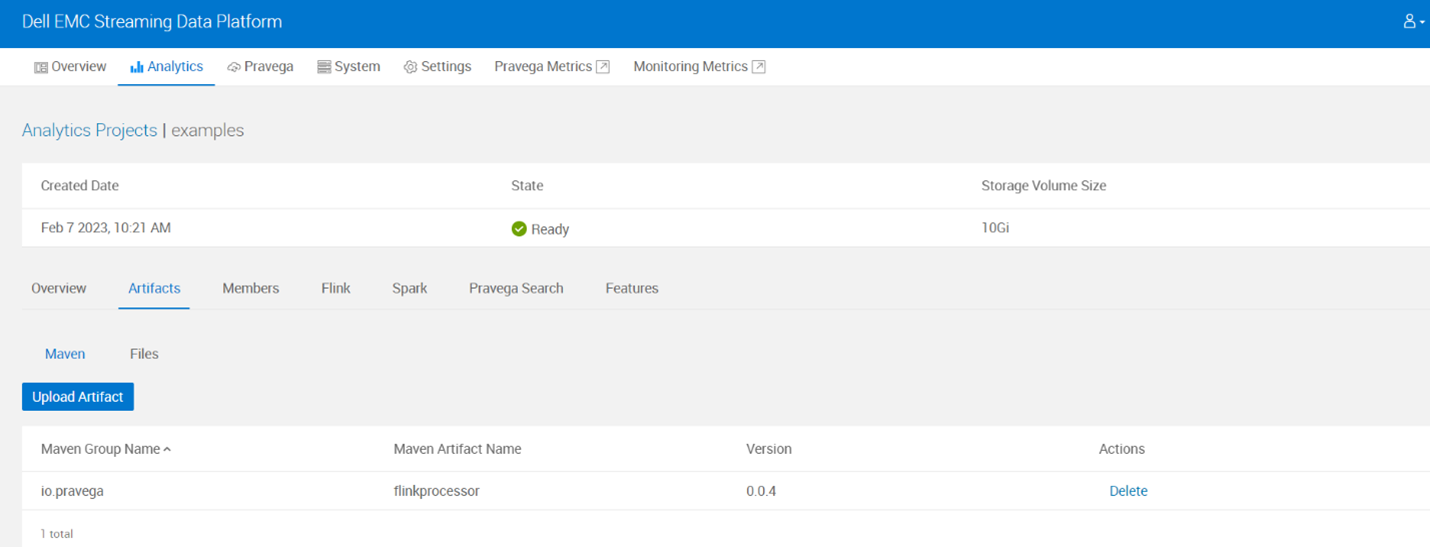
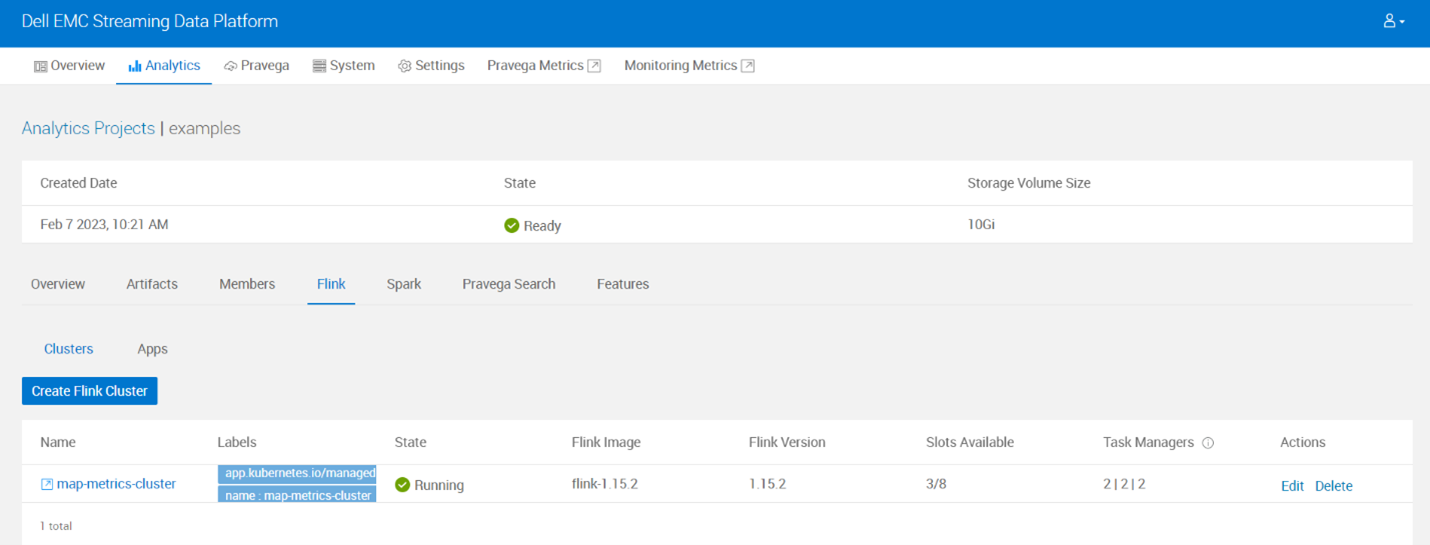
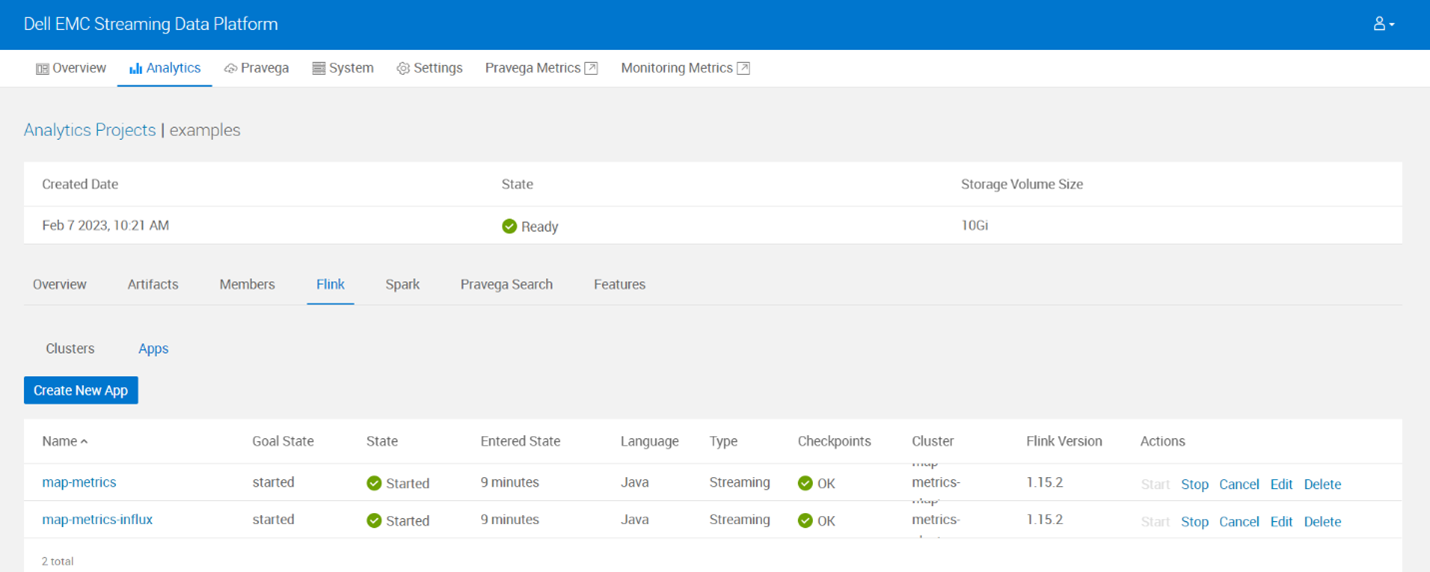
- Flink Jobs: The user can add the Flink Jobs they want to run. The default Flink jobs are install_map_metrics and install_map_metrics_dashboards, which create Grafana dashboards shown below. These Flink jobs are written in Java. To view them, go into the folder flinkprocessor/src/main/java/io/pravega/flinkprocessor. The input format is shown in Figure 10 below.
  flinkJobs:
  - name: install_map_metrics
  - name: install_map_metrics_dashboards
Figure 7: Default Flink Jobs for this project
Steps of Installation:
-
Setting up the code sample:
- Clone the GitHub repo on your local machine.
- Go into the telcom-demo-app-bundle folder and open the sample.yaml file.
- Under global.streams[0].Inputs change the inputs to your data sources, use current Inputs as reference. For each input include the name of the stream, prometheusCheck, and input to your data source. An example of an input template is:
input<number>:
        name: <streamName>
        prometheusCheck: <true or false> # true if you want to push data to prometheus
        input: <Input to your datasource>
Figure 8: Telegraf Input template
Run default Flink Jobs:
- If the user wants to run the existing Flink jobs: Map Metrics and Map Metrics Dashboard, the user can add install_map_metrics and install_map_metrics_dashboard under global.flinkJobs. If the user adds new inputs which are different from idrac, vsphere and k8s they would need to create a new Flink job or update map metrics code for the new streams. The user can also choose to add any metric to the output stream(mappedMetrics) which gets created when running the Flink job map by updating the MapMetrics.java file.
  flinkJobs:
  - name: install_map_metrics
  - name: install_map_metrics_dashboards
Figure 9: Default Flink Jobs created for this project
Create your own Flink Jobs:
- If the user wants to add their own Flink Jobs, they can add a name in this format under flinkJobs:
  flinkJobs:
  - name: <Flink Job Name>
Figure 10: Flink Job Template
- Next, go into the folder charts and create a new folder with the yaml files for the new Flink job. Use map-metrics as reference when creating new Flink job yaml files.
- Next, go into the folder scripts and create a new shell script with the same name provided under flinkJobs. Use install_map_metrics.sh as reference when creating a new script.
- Finally, if the user wants to send data to influxDB, go into the folder scripts and flinkJobSetup.py and modify the script to update influxdb details. Refer to the code block #updating map-metrics-values.yaml influxdb details in the flinkJobSetup.py for reference.
Install the Project:
- Finally, after the sample.yaml file has been configured to add inputs and create new Flink jobs or use the default ones provided, run the install shell script.
- To run the install.sh script go to telcom-demo-app-bundle folder and run the command ./install.sh. This sets up the project with the streams provided from the input and runs Flink jobs.
Steps of Demo Running:
- After running the install.sh shell script, check if a project named examples got created in the SDP UI.
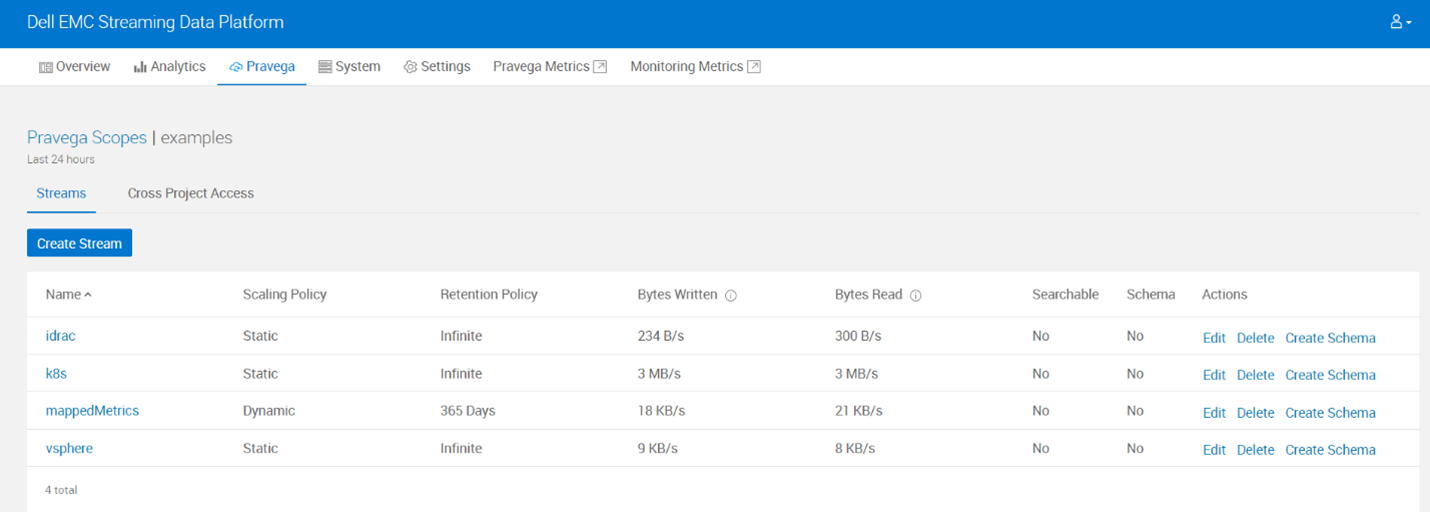
- Check if Pravega streams got created for the project. For this example, we have 3 streams idrac, vsphere and k8s which were configured in the master yaml file. Also, the mappedMetrics stream was created automatically after running Flink job map metrics.
- Check if flinkprocessor artifact was uploaded in SDP.
- Check if Flink cluster and apps got created in SDP.
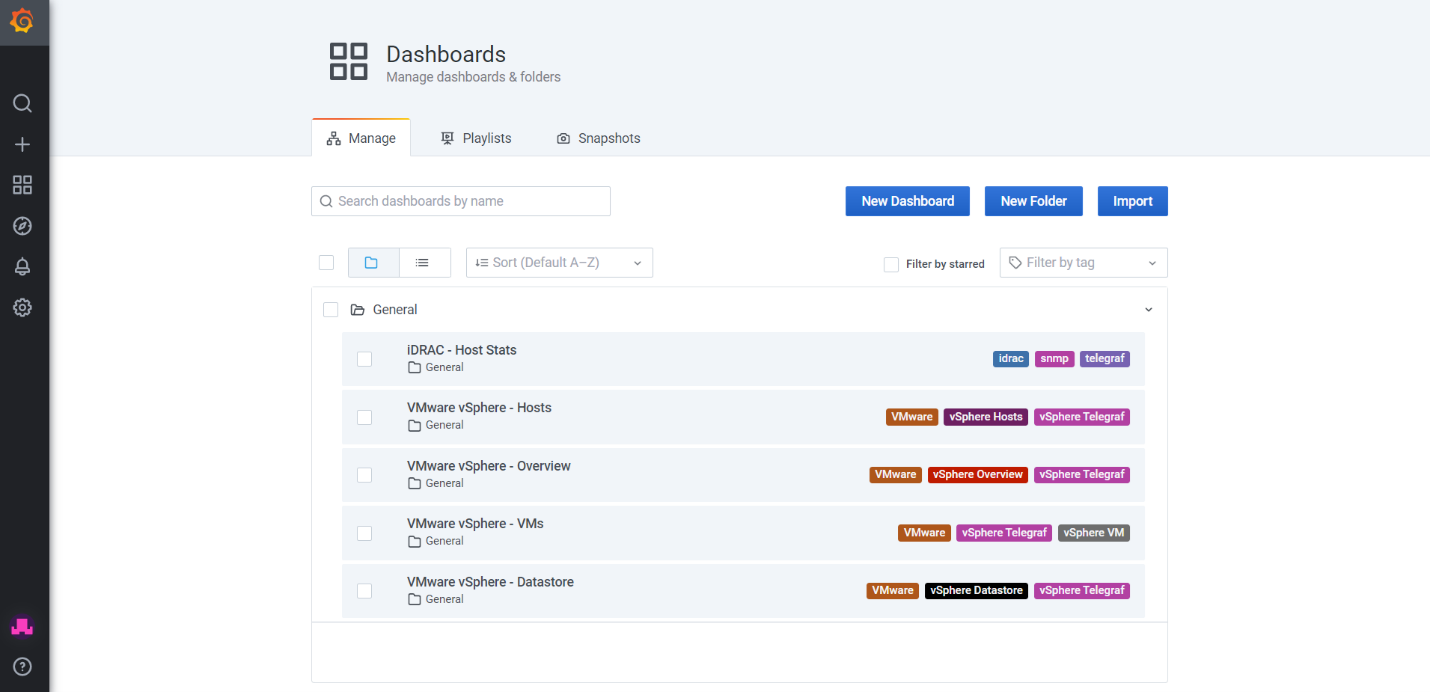
- Finally go to features and go to the Metrics endpoint and check if Grafana dashboards are loaded with data.
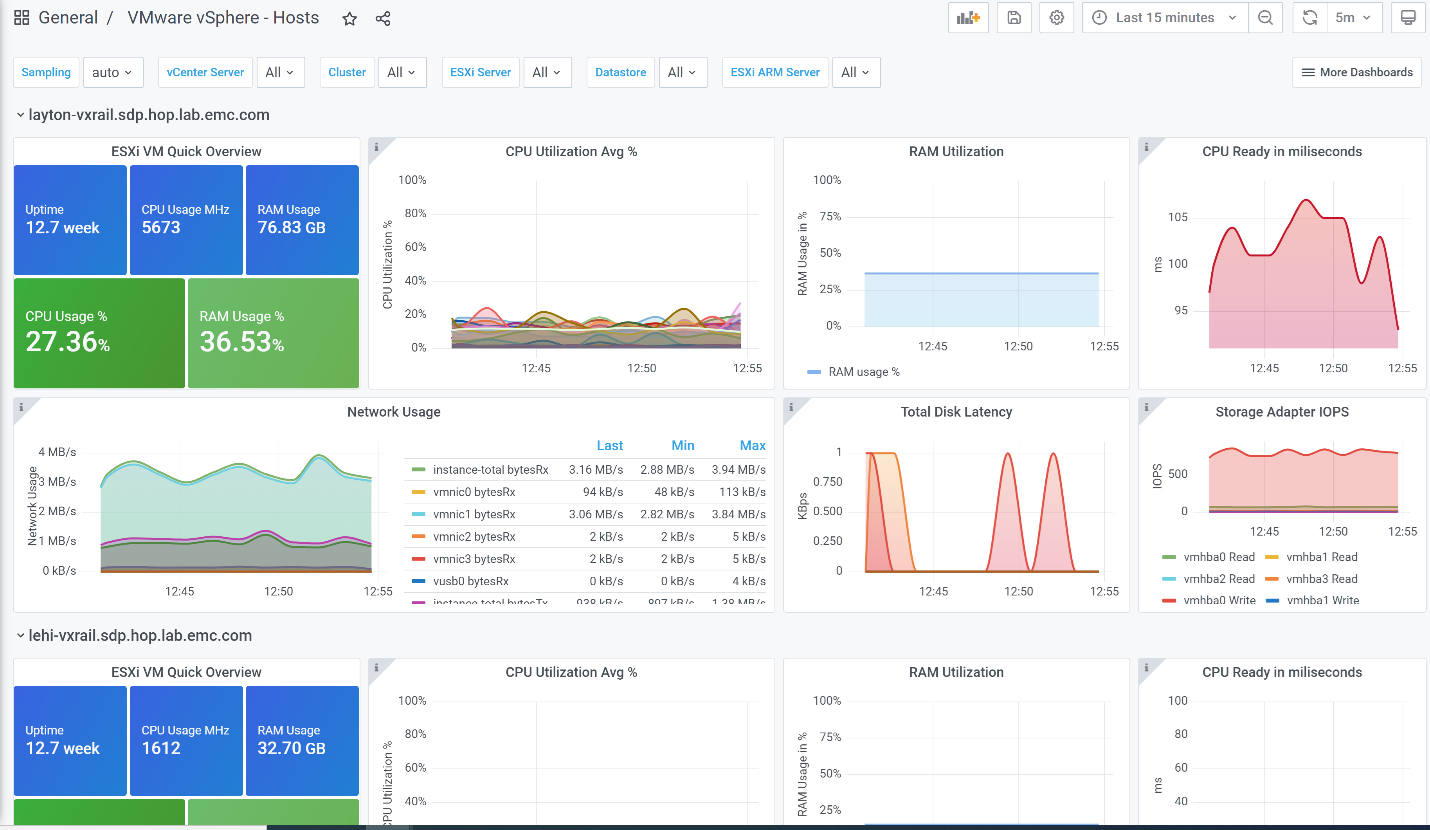
- Screenshot below shows the VMware vSphere – Hosts dashboard with all the live data
Uninstall Project
- First find all streams created by Telegraf using the command: kubectl get pods -n “projectname”. An example of idrac, vsphere and k8s are shown below.

- Stop each stream that has “telegraf” using the command: helm del “podname” -n “projectname”
- Delete the Flink jobs/cluster, Pravega streams and project in that order from the SDP UI or update the uninstall.sh shell script with the new streams and run it.
Troubleshooting
- Line 29 in the install script is commented out when first installing. If you are running install script again uncomment line 29 #sudo keytool -delete -noprompt -alias sdp-repo -keystore /etc/ssl/certs/java/cacerts -storepass changeit
- If there is error with openssl importing java certs go to the file: /etc/hosts and delete the repo-“projectName”.”clusterinfo”.sdp.hop.lab.emc.com near the top of the file.
- If the Flink job is not running make sure in the sample yaml file the storageClassName is set to your storage class name. To find out your default storageClassName run kubectl get storageclass
- In the charts folder map-metrics-influxdb-sink-values.yaml and map-metrics-values.yaml make sure to have supported flink images. To find supported flink images go to the SDP UI and open the System tab and under the Runtimes tab, the supported flink versions will be available.
- If telegraf pods fail to get created and there is an image issue it is because Docker rate limit has been reached. To resolve this build the telegraf image from the docker file. https://hub.docker.com/_/telegraf
Source
https://github.com/StreamingDataPlatform/telcom-demo-app-bundle
License / Copyright
Telegraf license: MIT License