Customer jumpstart on SDP video analytics use case demo.
Introduction
SDP can ingest all types of data as a simple byte stream. One of the most popular use cases customers and prospects discuss is video data because it has the potential to provide a unique real-time value to their business.
With that said, one of the biggest challenges with video data is the volume and complexity of video data, especially considering many times the video data is not valuable, such as nighttime cameras watching an empty parking lot or server room with no activity in it.
SDP can provide a solution to this challenge by analyzing the real-time video stream and making decisions on whether the contents have valuable (object detection) or unusual (anomalies) information that can be extracted and organized for user or system consumption for further analysis.
Retail stores, factories and parking slots with surveillance cameras can use SDP to record the camera video streams in parallel, do analysis and drive real-time dashboards and alerts.
Human Detection Demo
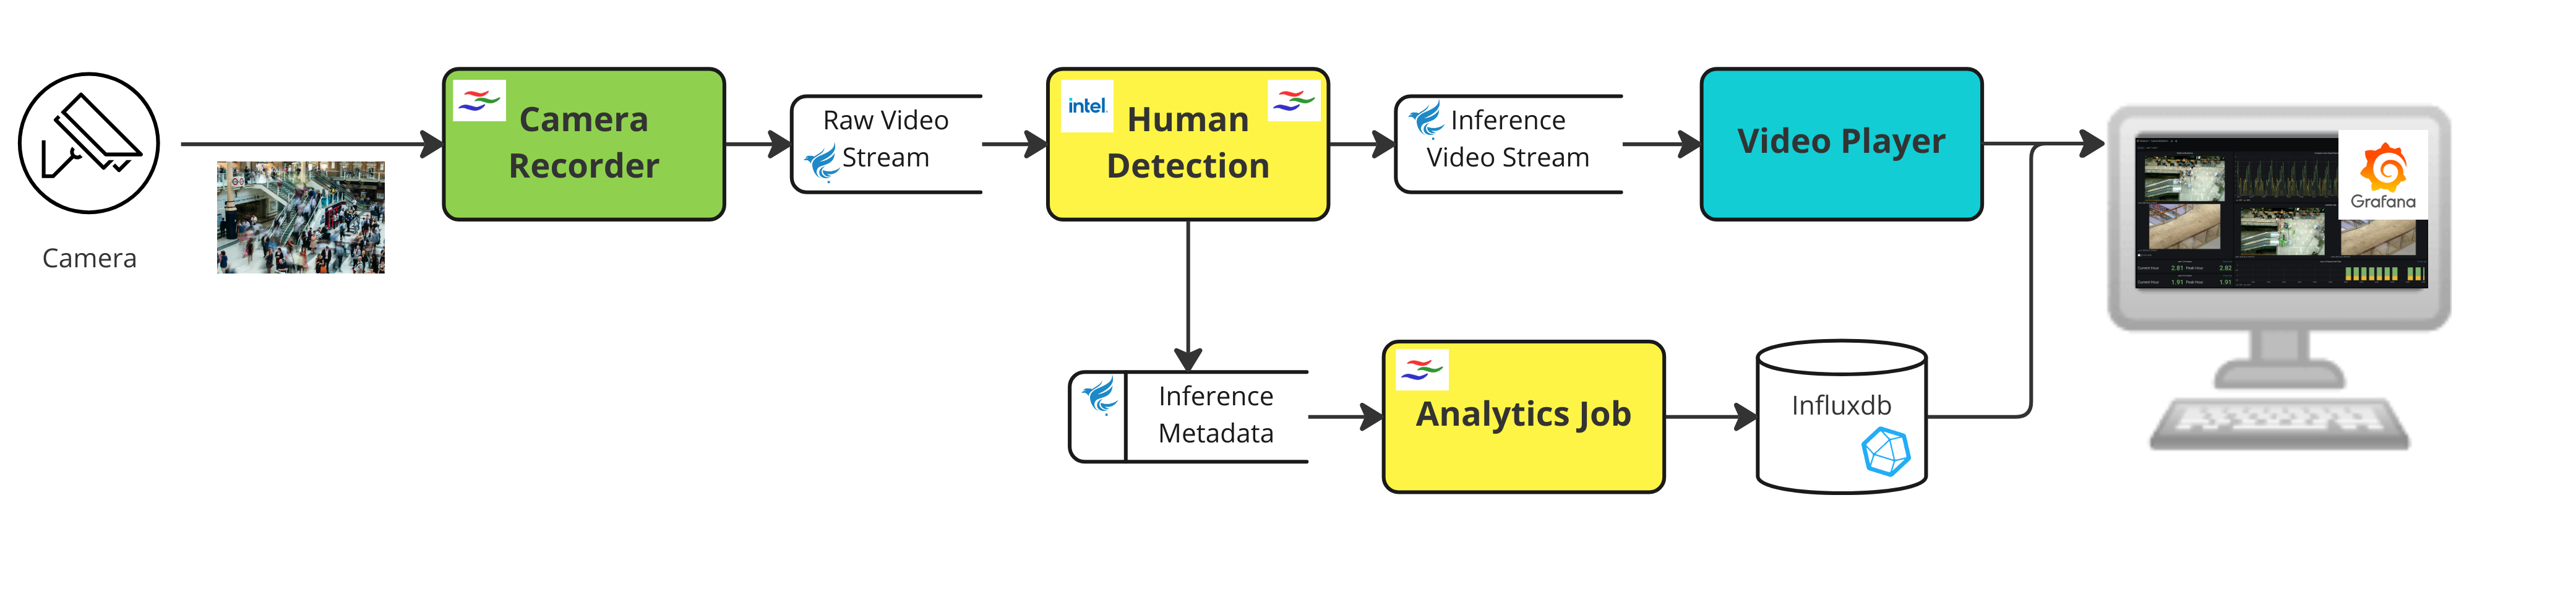
The following Streaming Data Platform (SDP) application example showcases a human detection use-case that counts the number of humans in a specific region, and involves the easy ingestion, analysis and metadata extraction of real-time video data.
SDP would continuously record the video streams from RTSP cameras and persist onto the tier 2 storage asynchronously on the backend. Users could enable retention policy on the video streams (by days, by size, or both) based their business requirements. The human detection GStreamer pipeline would send and persist the analytics result to influxdb within milliseconds after the video stream is recorded. Grafana dashboard would only query and display the video clips according to users’ time range selection.
The included code sample lets user run an install script to easily setup and config necessary components. After creating a project on SDP and GStreamer pipelines, users would be able to monitor the video streams and analytics details on a dashboard.
Design/Detail
This high-level diagram highlighted shows all the components which are used in this sample application.
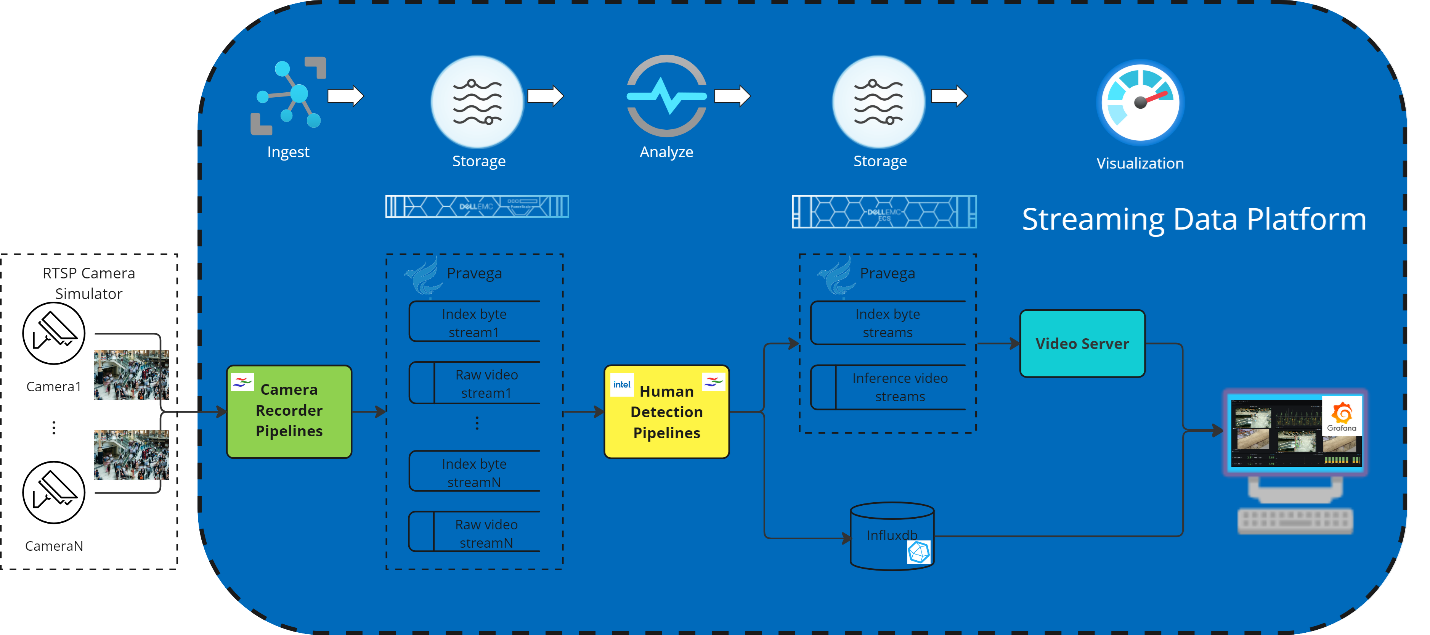
Figure 1: Architecture design
-
The first component within the RTSP Camera Simulator box represents the simulated RTSP cameras which represent surveillance cameras in a shopping mall. It is an external component outside of SDP, deployed for the purpose of the demo.
-
The second component, from the left (designated in green) is the SDP built-in RTSP camera recorder pipeline which is used to record the video streams from RTSP cameras and ingest them into the SDP Pravega instance. One recorder pipeline will be set for one camera each.
-
The third component (in Pravega box) is the SDP Pravega which persists each video stream from one camera into two unbounded byte streams internally (one byte stream for raw video stream, and another for index).
-
The fourth component next (in yellow), represents the GStreamer based human detection pipeline which would read the raw video streams recorded by camera recorder pipeline, draw bounding box based on the human detection result, save the annotated video stream in inference stream which is a separated byte stream and send the analysis results of the number of humans detected in each frame to InfluxDB. One for each camera recorder pipeline.
-
The fifth component (with cyan background) is the Pravega video server which allows all major web browsers to play historical and live video. It is an HTTP web service that supports HTTP Live Streaming.
-
Finally, the last components represent where we are sending our results of the analysis, in this case InfluxDB database with Grafana to for analysis result storage and visualization. The Pravega Video player Grafana plugin would act as the HLS client to play the video streams on Grafana dashboard.
The camera recorder pipeline, Pravega video server and InfluxDB are built-in SDP features and RTSP camera simulator, human detection pipeline and Pravega Video player Grafana plugin are additional components for this demo.
Instructions
Installation
- Check Prerequisites
-
Make sure SDP is installed and setup.
-
Make sure you have following prerequisite for installation script:
-
helm v3
-
kubectl
-
Python3
-
-
[Skip if SDP cluster has public internet access] Make sure to pull the docker images from public github packges at https://github.com/orgs/StreamingDataPlatform/packages and push to the private docker registry that is accessible to SDP cluster. Here is the image list for this demo used and outside of SDP.
Id Components Image 1 RTSP camera simulator ghcr.io/streamingdataplatform/sdp-video-demos-rtsp-simulator:latest 2 Grafana ghcr.io/streamingdataplatform/sdp-video-demos-grafana:latest 3 Human Detection Pipeline ghcr.io/streamingdataplatform/sdp-video-demos-dlstreamer-pipeline:latest -
- Prepare installation script
-
Clone the sdp-video-demo repo on your local machine.
-
Navigate to
sdp-video-demos/human-detectionfolder. -
Check settings in
config.ini. Under most cases, you will only need to change project name to your desired SDP project name. In this tutorial we use “recorded-demo” for project name.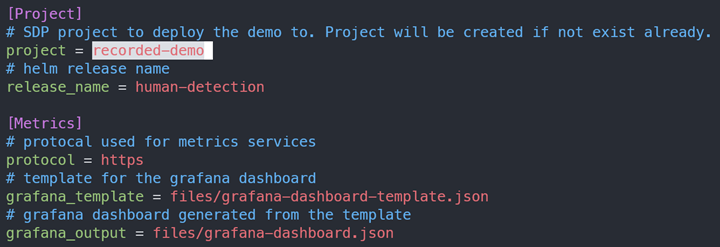
-
[Skip if SDP cluster has public internet access] Open
chart/values.yamlfile, change therepositoryof camera recorder, human detection, Grafana to images you prepared in step 1.
-
- Install demo using script
-
Script
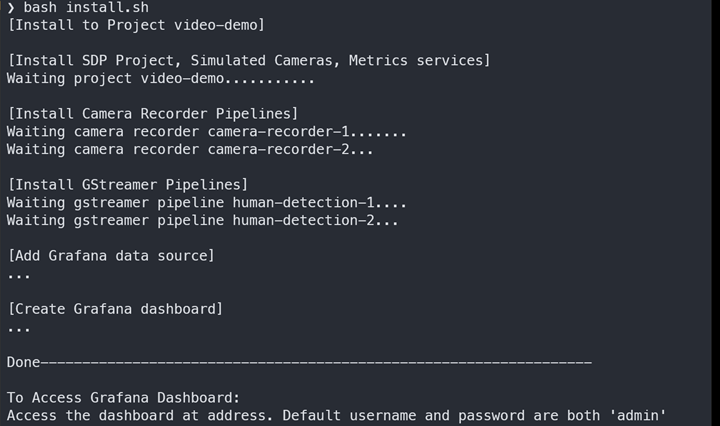
install.shwill take care of installation from creating SDP project to setting up a Grafana dashboard with inference on 2 simulated camera sources:bash install.sh -
Example script output:
-
- [Optional] Verify installation in SDP UI
-
Navigate to “SDP” -> “Analytics”. A new project “recorded-demo” should be created:
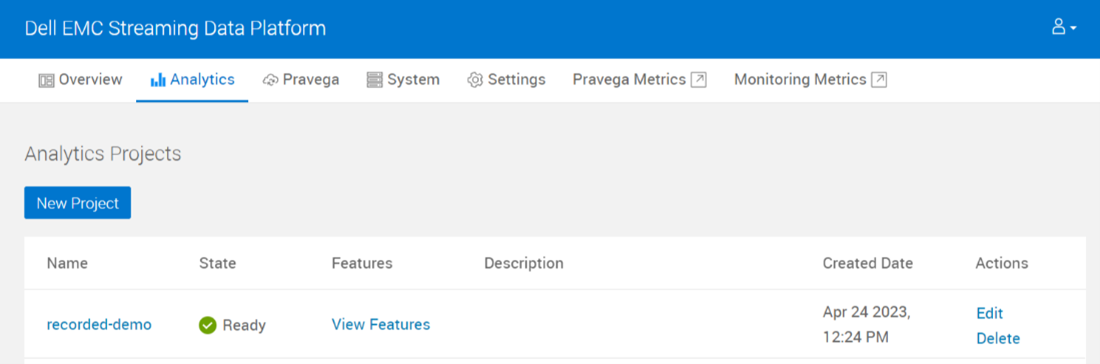
-
Open the project, navigate to “Video” panel. There should be 2 Gstreamer Pipelines, 2 Camera Recorder Pipelines, and one Camera Secret for simulated cameras as in following screenshots:
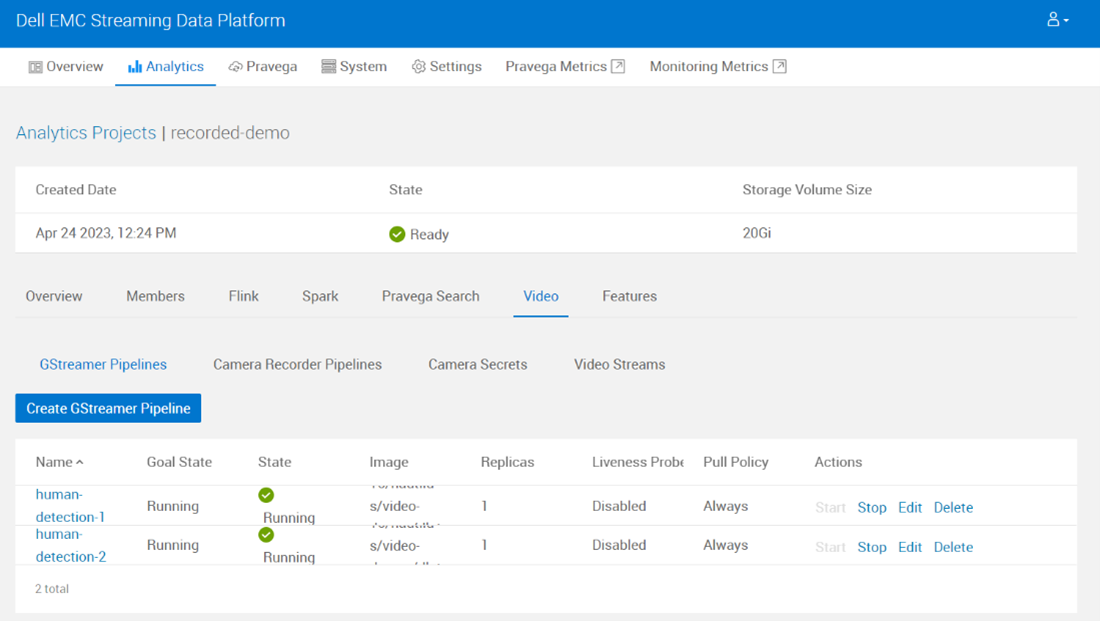
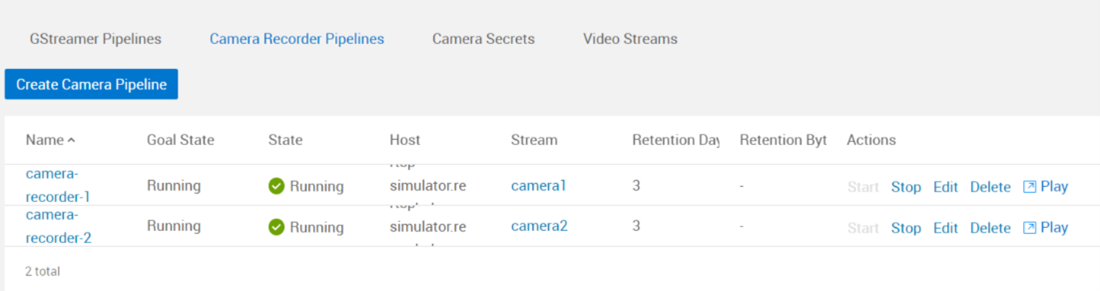
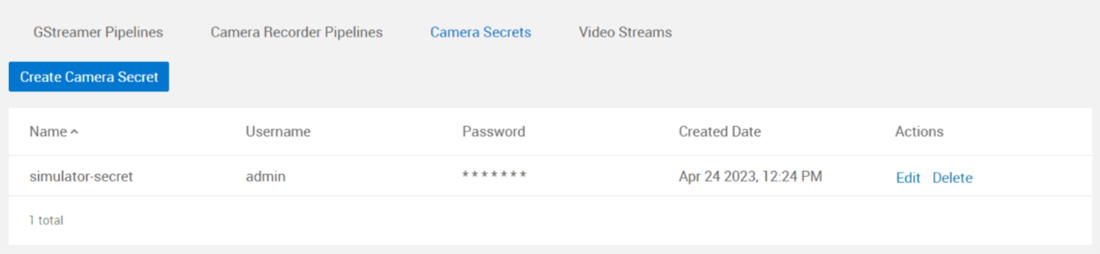
-
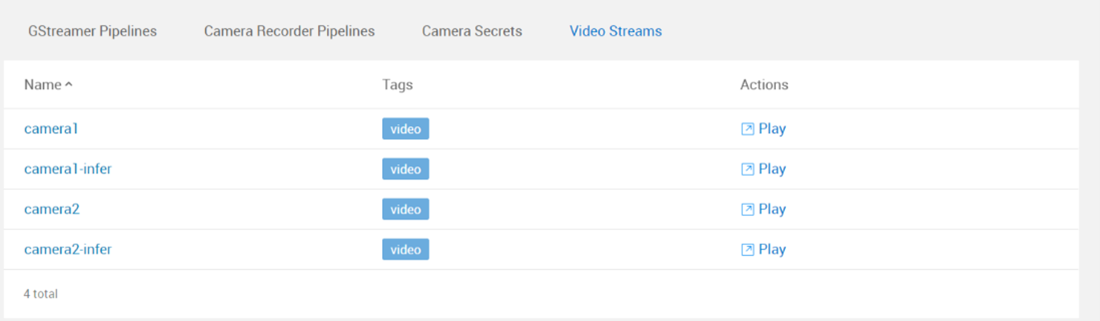
In “Video Streams”, user can play raw and inferred video streams from both camera:
From camera1 stream:
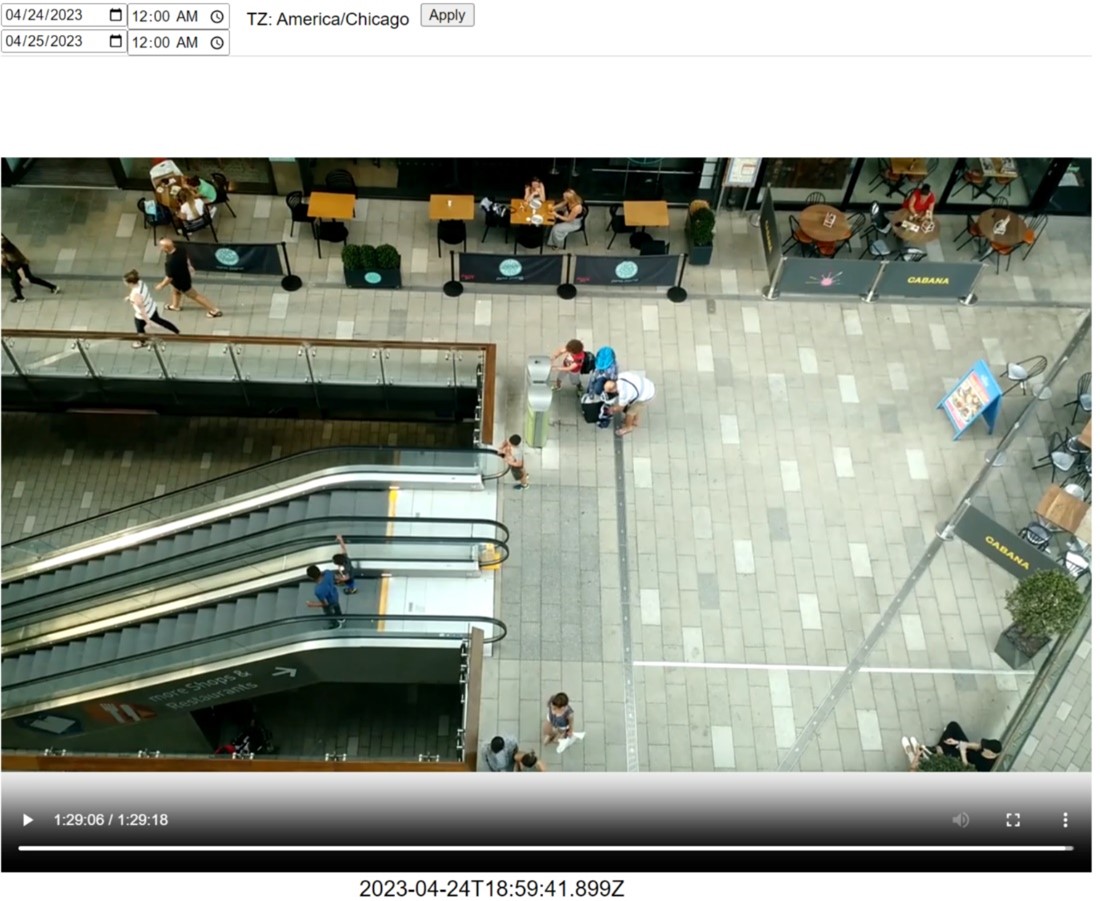
From camera1-infer stream. Note that this pipeline has RoI(Region of interest):
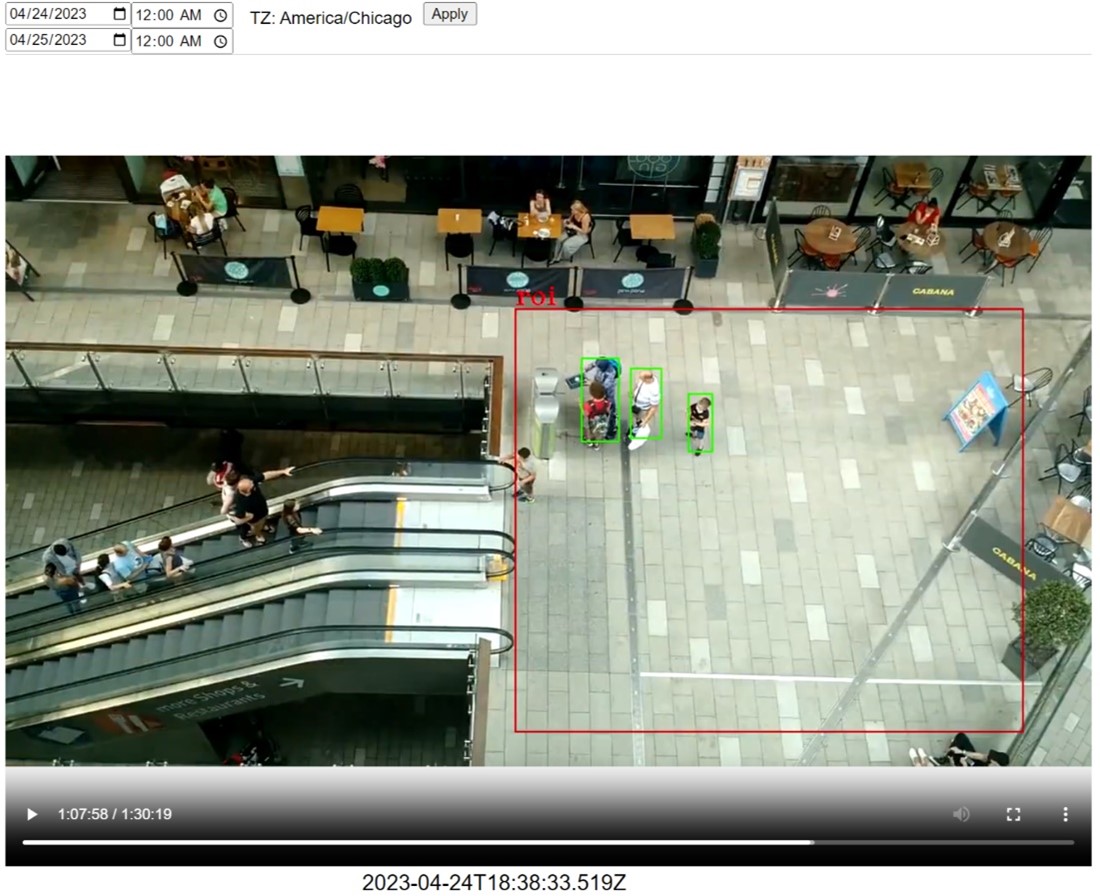
-
- Check Grafana dashboard
-
Using address given at the end of installation script to access Grafana dashboard:
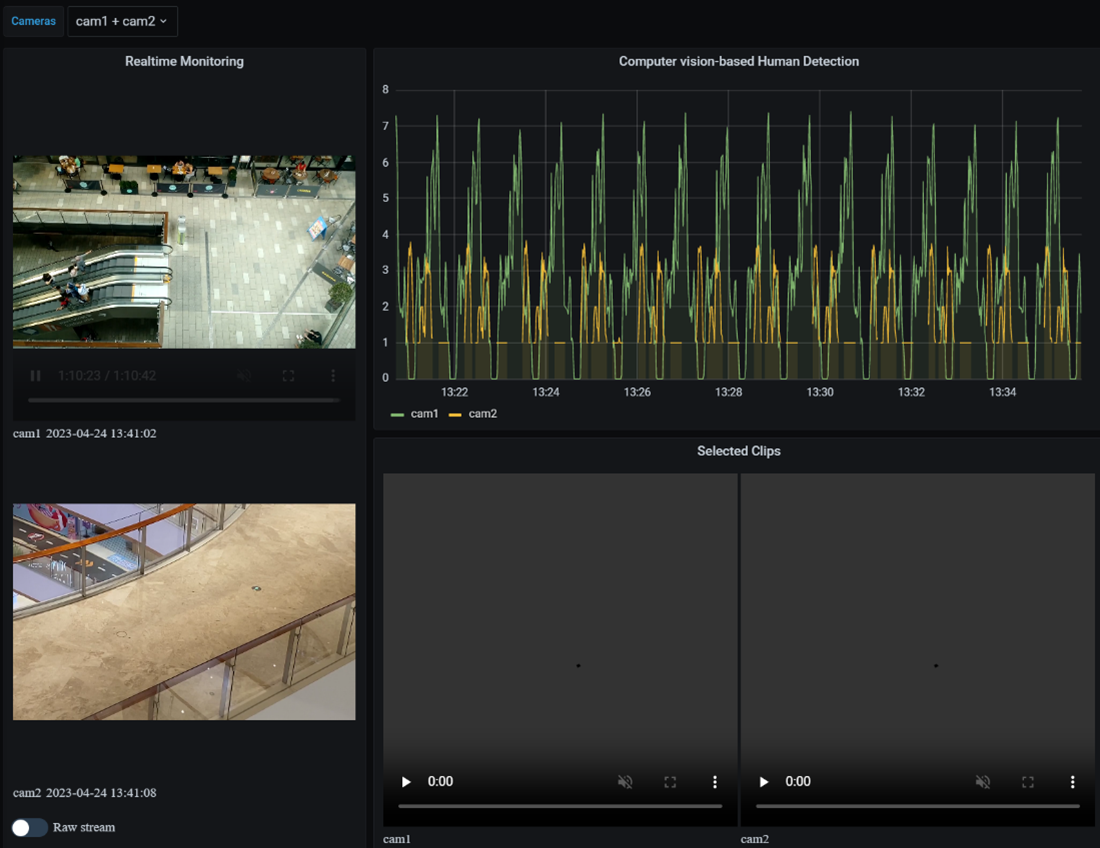
-
On the left column shows full video streams for both cameras. On the bottom a toggle is for toggling between raw and inferred streams.
-
On the right column shows timeline and number of humans detected over time. Crop on timeline allows selecting inferred video clips from that time.
-
Uninstallation
- To uninstall demo and delete SDP project, use SDP UI or use uninstall script:
bash uninstall.sh
Detailed explanation
The End-to-End flow of this code sample can be thought of like this:
-
First the RTSP camera simulator generates continuous video streams. It keeps reading pre-recorded video files located in the folder of /opt/videos in loop and sending it out as RTSP stream. You can skip deploying the simulator by setting
simulated_camerato false inconfig.inifile if wanna connect to real RTSP cameras and just setup camera recorder pipeline to point to the real camera path in step 2. -
The camera recorder pipelines capture video streams from RTSP camera simulator by default and save into Pravega. To change the
address,port,path,secretunder global.recorderPipeling in chart/values.yaml file if set to connect to real RTSP cameras. One pipeline for one RTSP camera each. -
The sample human detection reads from the recorded Pravega streams, proceeds the inference, and writes a new stream with bounding boxes and send the analysis results out to InfluxDB.
-
InfluxDB server is a SDP build-in feature and would be automatically installed during SDP Analytics Project creation with the feature of
Metricsenabled. And Video server is the same and would be auto installed with the feature ofVideo Serverenabled. -
Finally, the results can be visualized on the Grafana dashboards. This sample would install external built Grafana image instead of using the Grafana instance installed together with InfluxDB when “Metrics” feature is selected, because the SDP integrated Grafana won’t allow user to install self-built panel plugins right now.
Source
License / Copyright
-
Code base for this demo is under Apache License 2.0
-
RTSP Simulator image uses https://github.com/pravega/gstreamer-pravega under Apache License 2.0
-
Grafana image is built on Grafana 7.5.17 under Apache License 2.0, and HLS.js under Apache License 2.0
-
Human Detection Image uses GStreamer element under LGPL License and dlstreamer element under MIT License